
Cohort Report
A comprehensive analysis of project progress, improvement patterns, and strategic recommendations.
Page 1
ADOPTIC
Cohort Analysis Report
Summer 2025 Cohort 1
A comprehensive analysis of project progress and accomplishments, improvement patterns,
and strategic recommendations for future cohorts.
Page 2
Adoptic: A Crash Course
1. Adoptic has 70 empirically established variables
2. Each variable is assessed using levels of evidence from 0 to 5
0
1
2
3
4
5
3. We look for two things:
High levels of evidence
New accomplishments establishing growth in levels of evidence
Page 3
Contents
Cover
1
Adoptic Crash Course
2
Contents
3
Executive Summary
4
1. Did The Projects Grow?
5
Spotlight: Project 1 and Project 2
6
Project Growth in Context
7
A Long Way To Go
8
2. What Did The Cohort Get Better At?
9
Filling Gaps in Awareness
10
Understanding Variable Improvement Patterns
11
3. What Impact Did The Program Have?
12
4. Target Variables and Recommendations
13
5. Conclusions
14
Page 4

Executive Summary
The analysis of project close out reports clearly shows the discussion of new and diverse
accomplishments, both deepening pre-existing strengths and broadening the scope of consideration.
The average level of evidence demonstrated by participants substantially increased. Projects also
substantially increased the number of variables addressed. Roughly 75% of variables improved were
newly addressed variables, establishing that the program increased awareness of causal variables of
success and failure. This marks a quantifiable improvement in the probability that participants will
achieve adoption outcomes (and thus become a viable business).
While the data shows many targeted variables progressed substantially, some target variables did not
see substantial improvement. More focus will be given to these select variables for cohort 2.
+516
Total improvement points across 11 projects
Page 5
1
Did The Projects Progress?
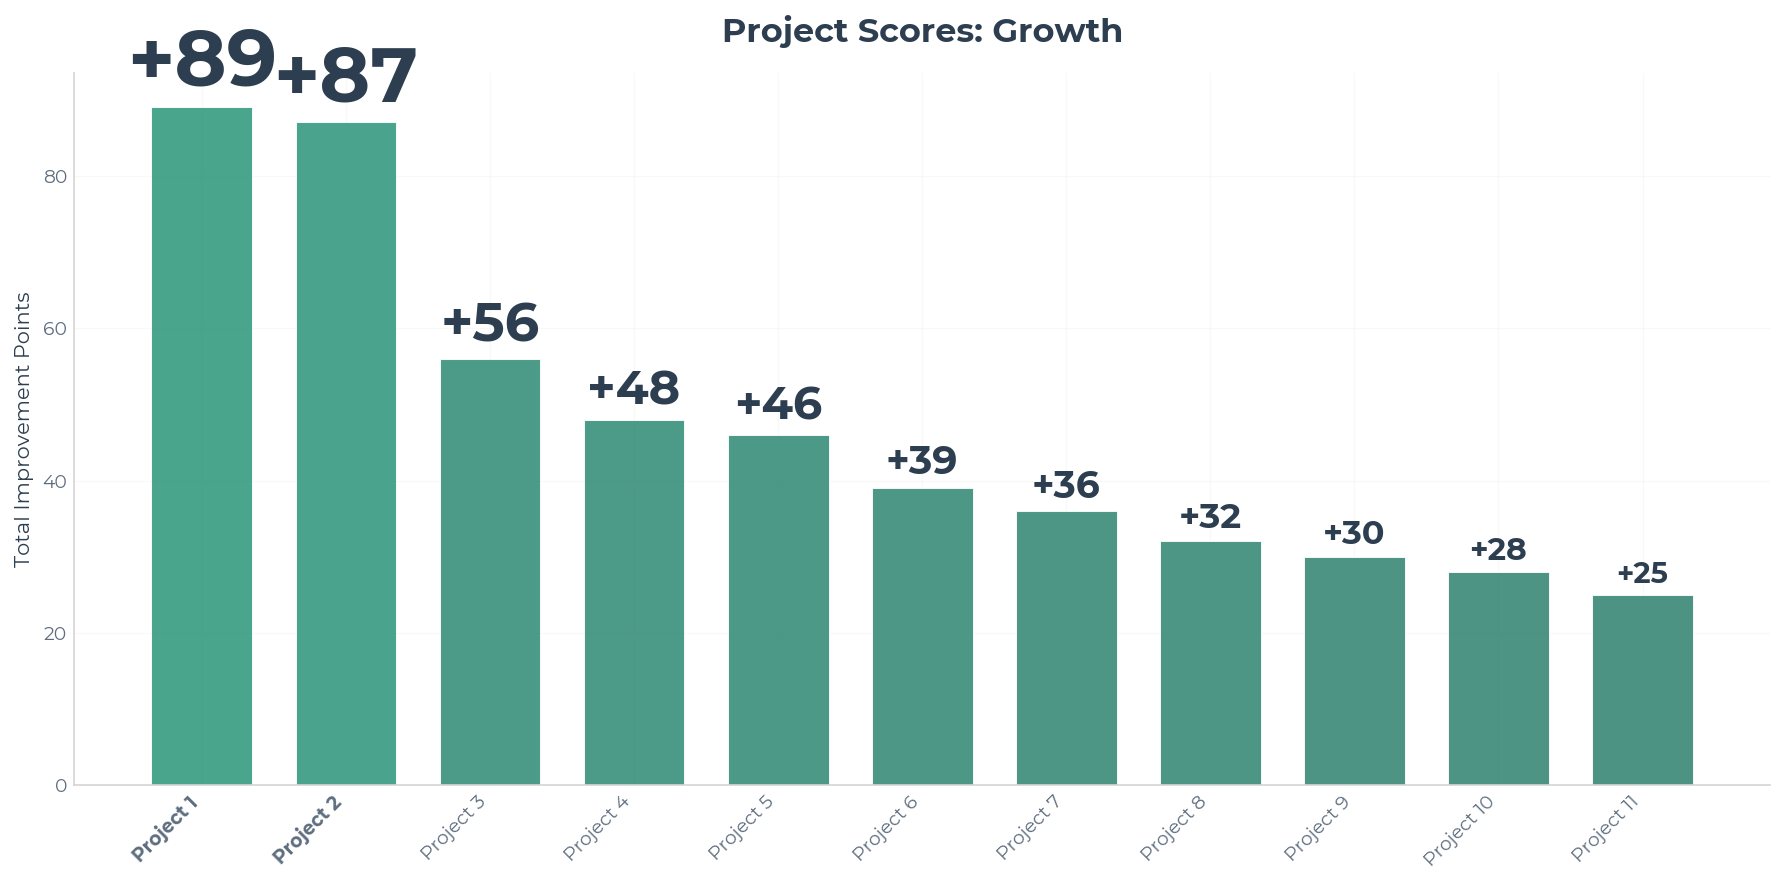
Chart 1a
↑
What it means
Each added point represents new evidence of improvement in a variable.
Think of each added point as a small accomplishment or milestone achieved by the project.
↓
What it says
Some projects accumulated quite a few points of improvement.
All projects grew.
Two projects stood out: Project 1 and Project 2.
Page 6
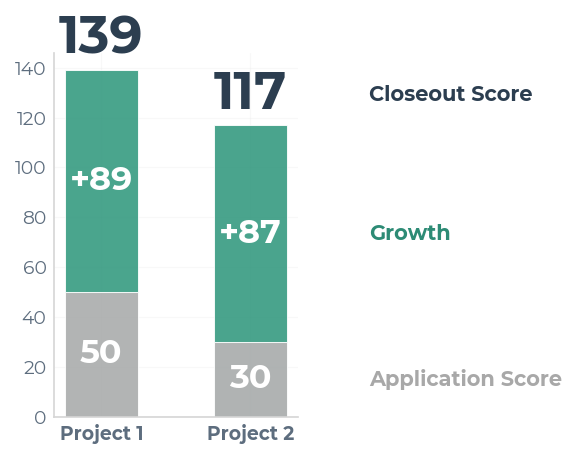
Spotlight: Project 1 and Project 2
Chart 1b
| Project 1 | Project 2 | |
|---|---|---|
| Growth Points | +89 | +87 |
| Application Score | 50 | 30 |
| Closeout Score | 139 | 117 |
Page 7
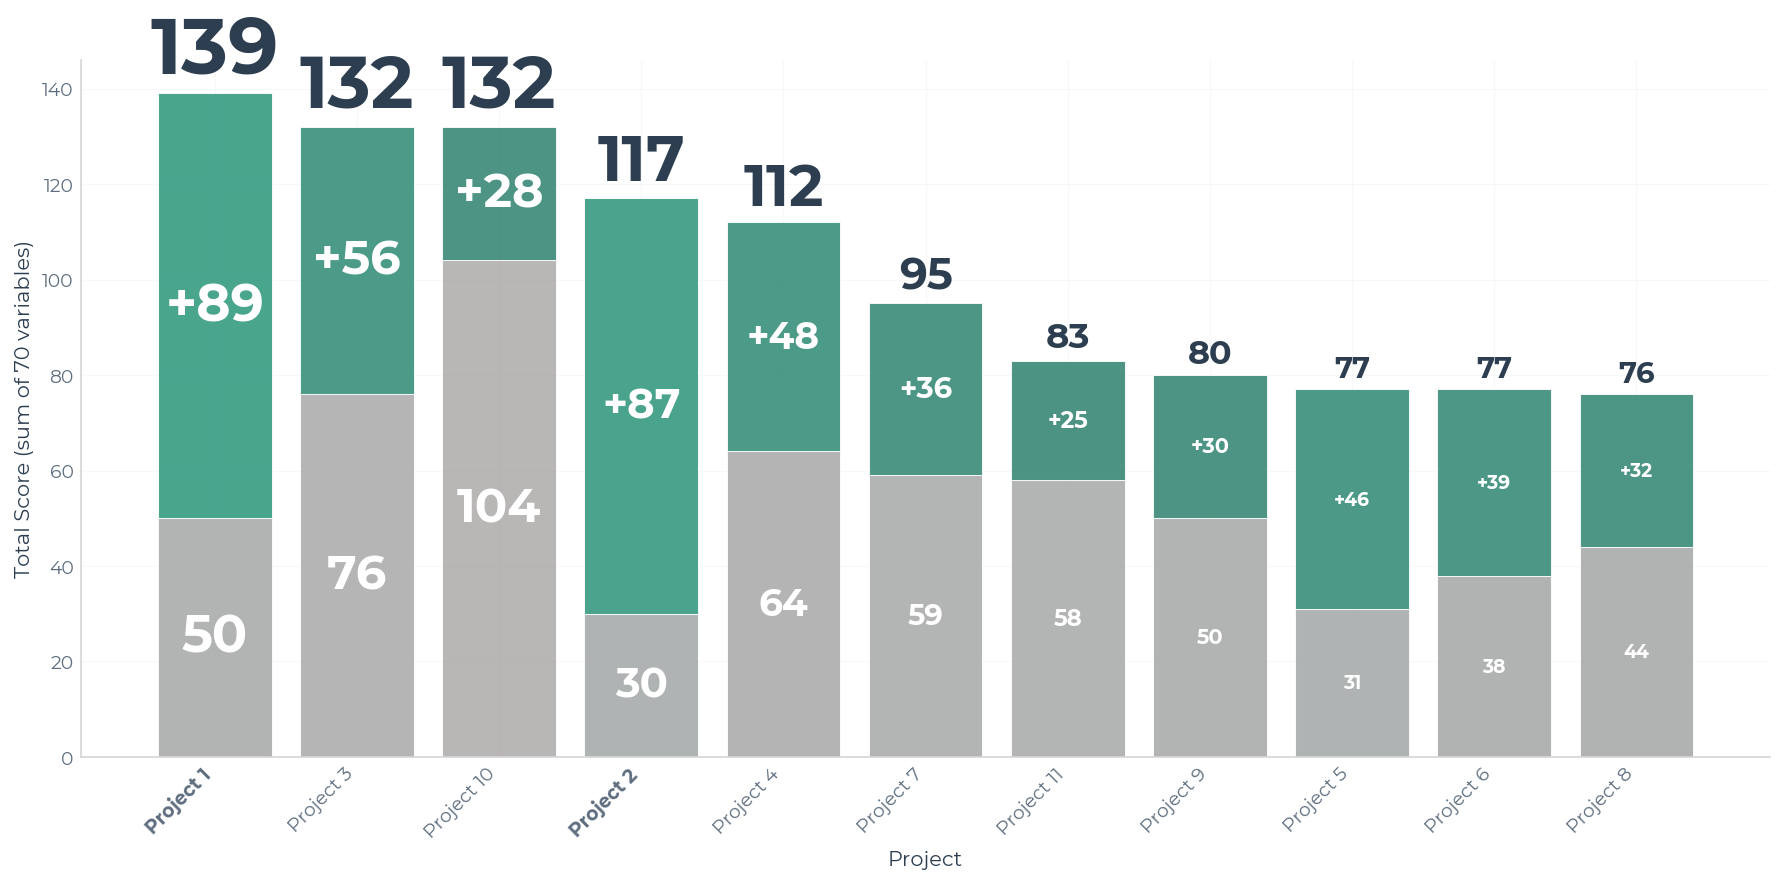
Project Growth in Context
Growth only tells us part of the story. We need to compare how these projects did overall.
Chart 1c
Page 8
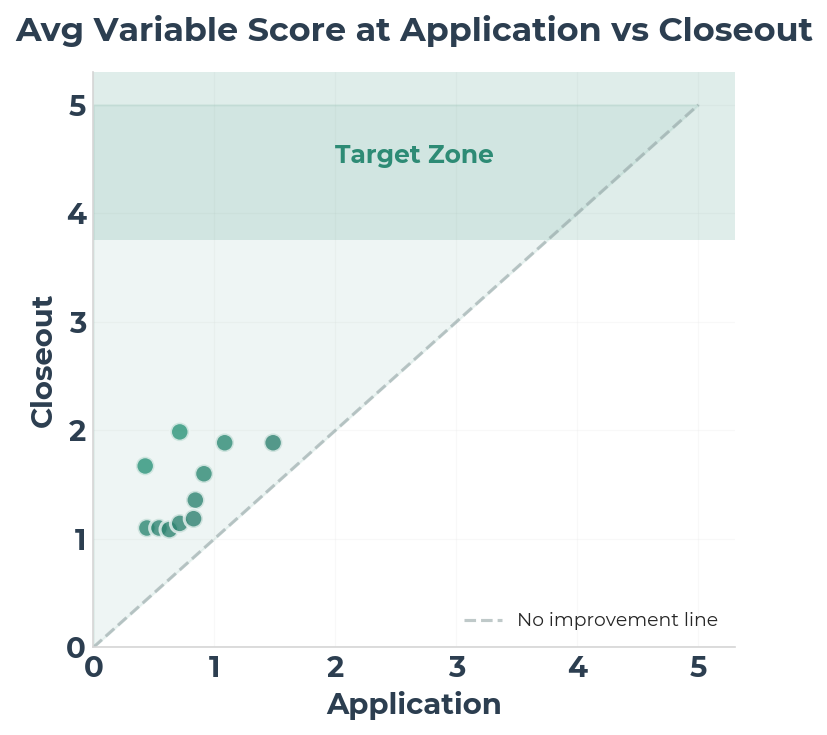
Chart 1d
These projects have done well, but there's still a long way to go.
The end-goal is to achieve an average of 4.5 for all targeted variables and an overall average of 3.75.
Page 9
2
What Did The Cohort Get Better At?
Chart 2a
Page 10
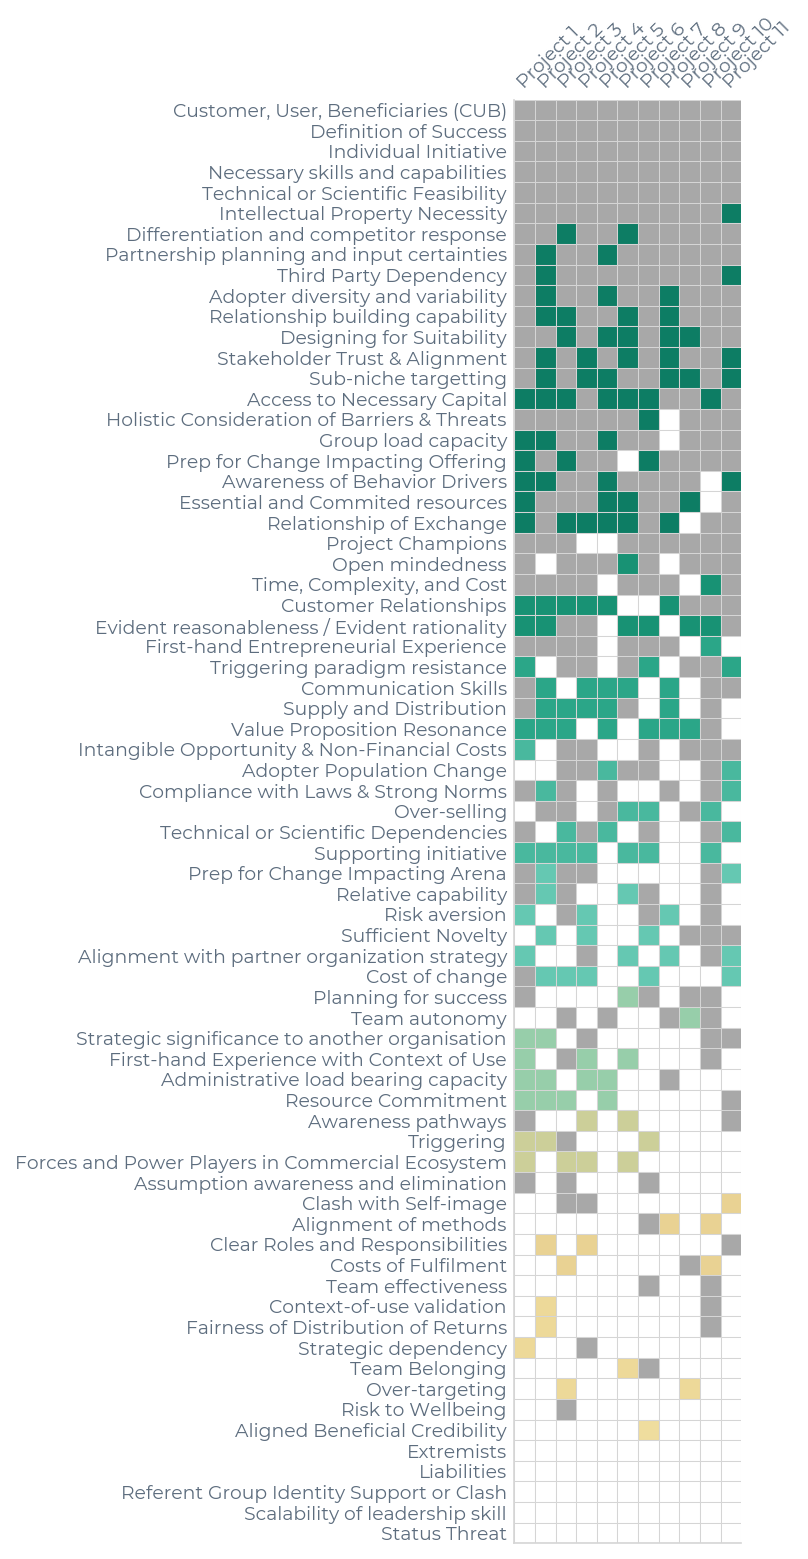
Filling Gaps in Awareness
Projects often fail because of gaps in their awareness. Therefore, one of our primary goals is to
ensure unconsidered variables get considered. This graphic shows all the variables that were present
in the application and highlights all the new variables addressed in the closeout report.
Chart 2b
Page 11
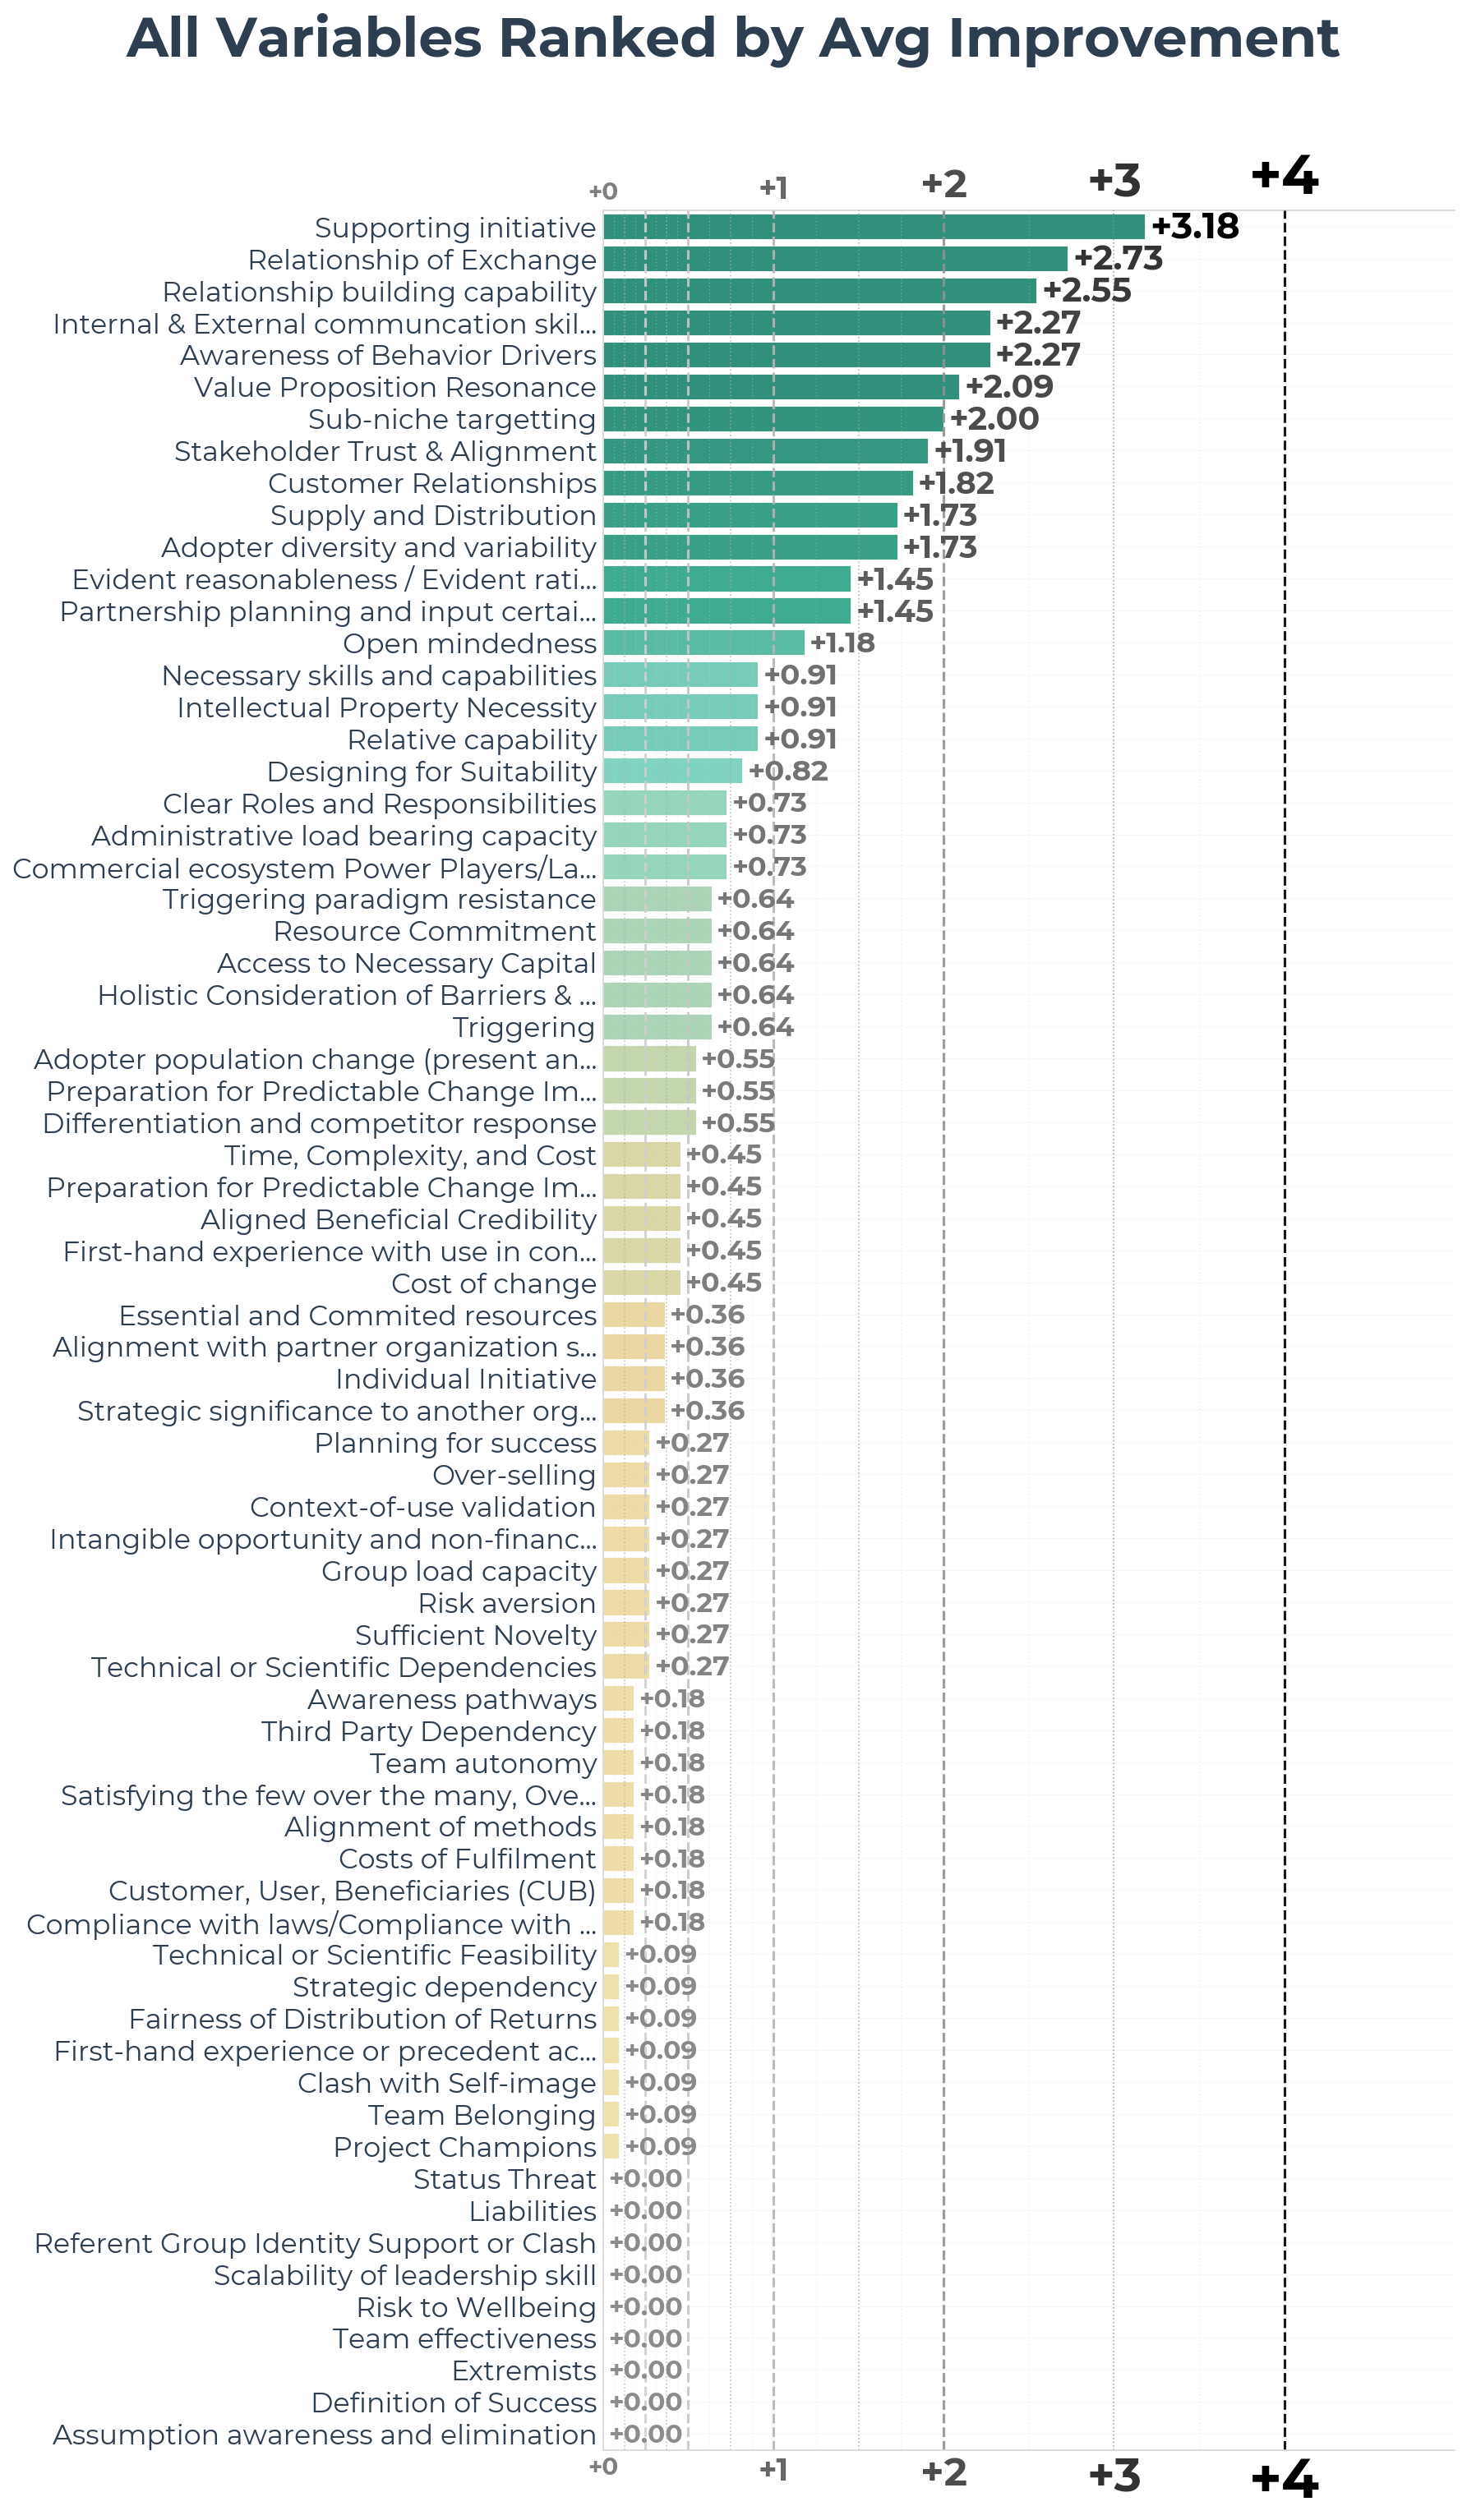
Understanding Variable Improvement Patterns
A high average level of evidence is predictive of success. Conversely, failure to consider, address,
or mitigate certain variables has been established as a predictor of failure. For example, a project
that loses its champion is very likely to fail. Additionally, we hypothesize that a large growth in
a project's average evidence level is a positive indicator of success.
A wide spectrum of variables show improvement and increased rates of consideration. However the degree
to which variables improved varied greatly. The varying levels of attention given to particular variables
is compounded by the foundational importance of certain variables like Supporting Initiative and
Relationship of Exchange. It is better to completely address these variables as early as possible.
The reasons we did not see an immediate fulfillment of all 70 variables over the course of the program thus far are five-fold:
(1) The aforementioned methods of prioritization. It is often more important to address some variables thoroughly as early as possible than to address all variables in a shallow manner.
(2) The groups contained participants at very different stages and arenas. Each received bespoke, individual guidance according to their unique needs and curiosities.
(3) The method of communication about some variables may have been ineffective. We discuss candidate variables for this condition in section 4.
(4) Some variables or levels of evidence may be hard or impossible to achieve for some projects in their present state. Many variables require deep involvement with the context of production or use.
(5) Some variables are unlikely to be discussed in the context of the closeout report format. Given that it is a short format, the applicants will prioritize what evidence to include.
Page 12
3
What Impact Did The Program Have?
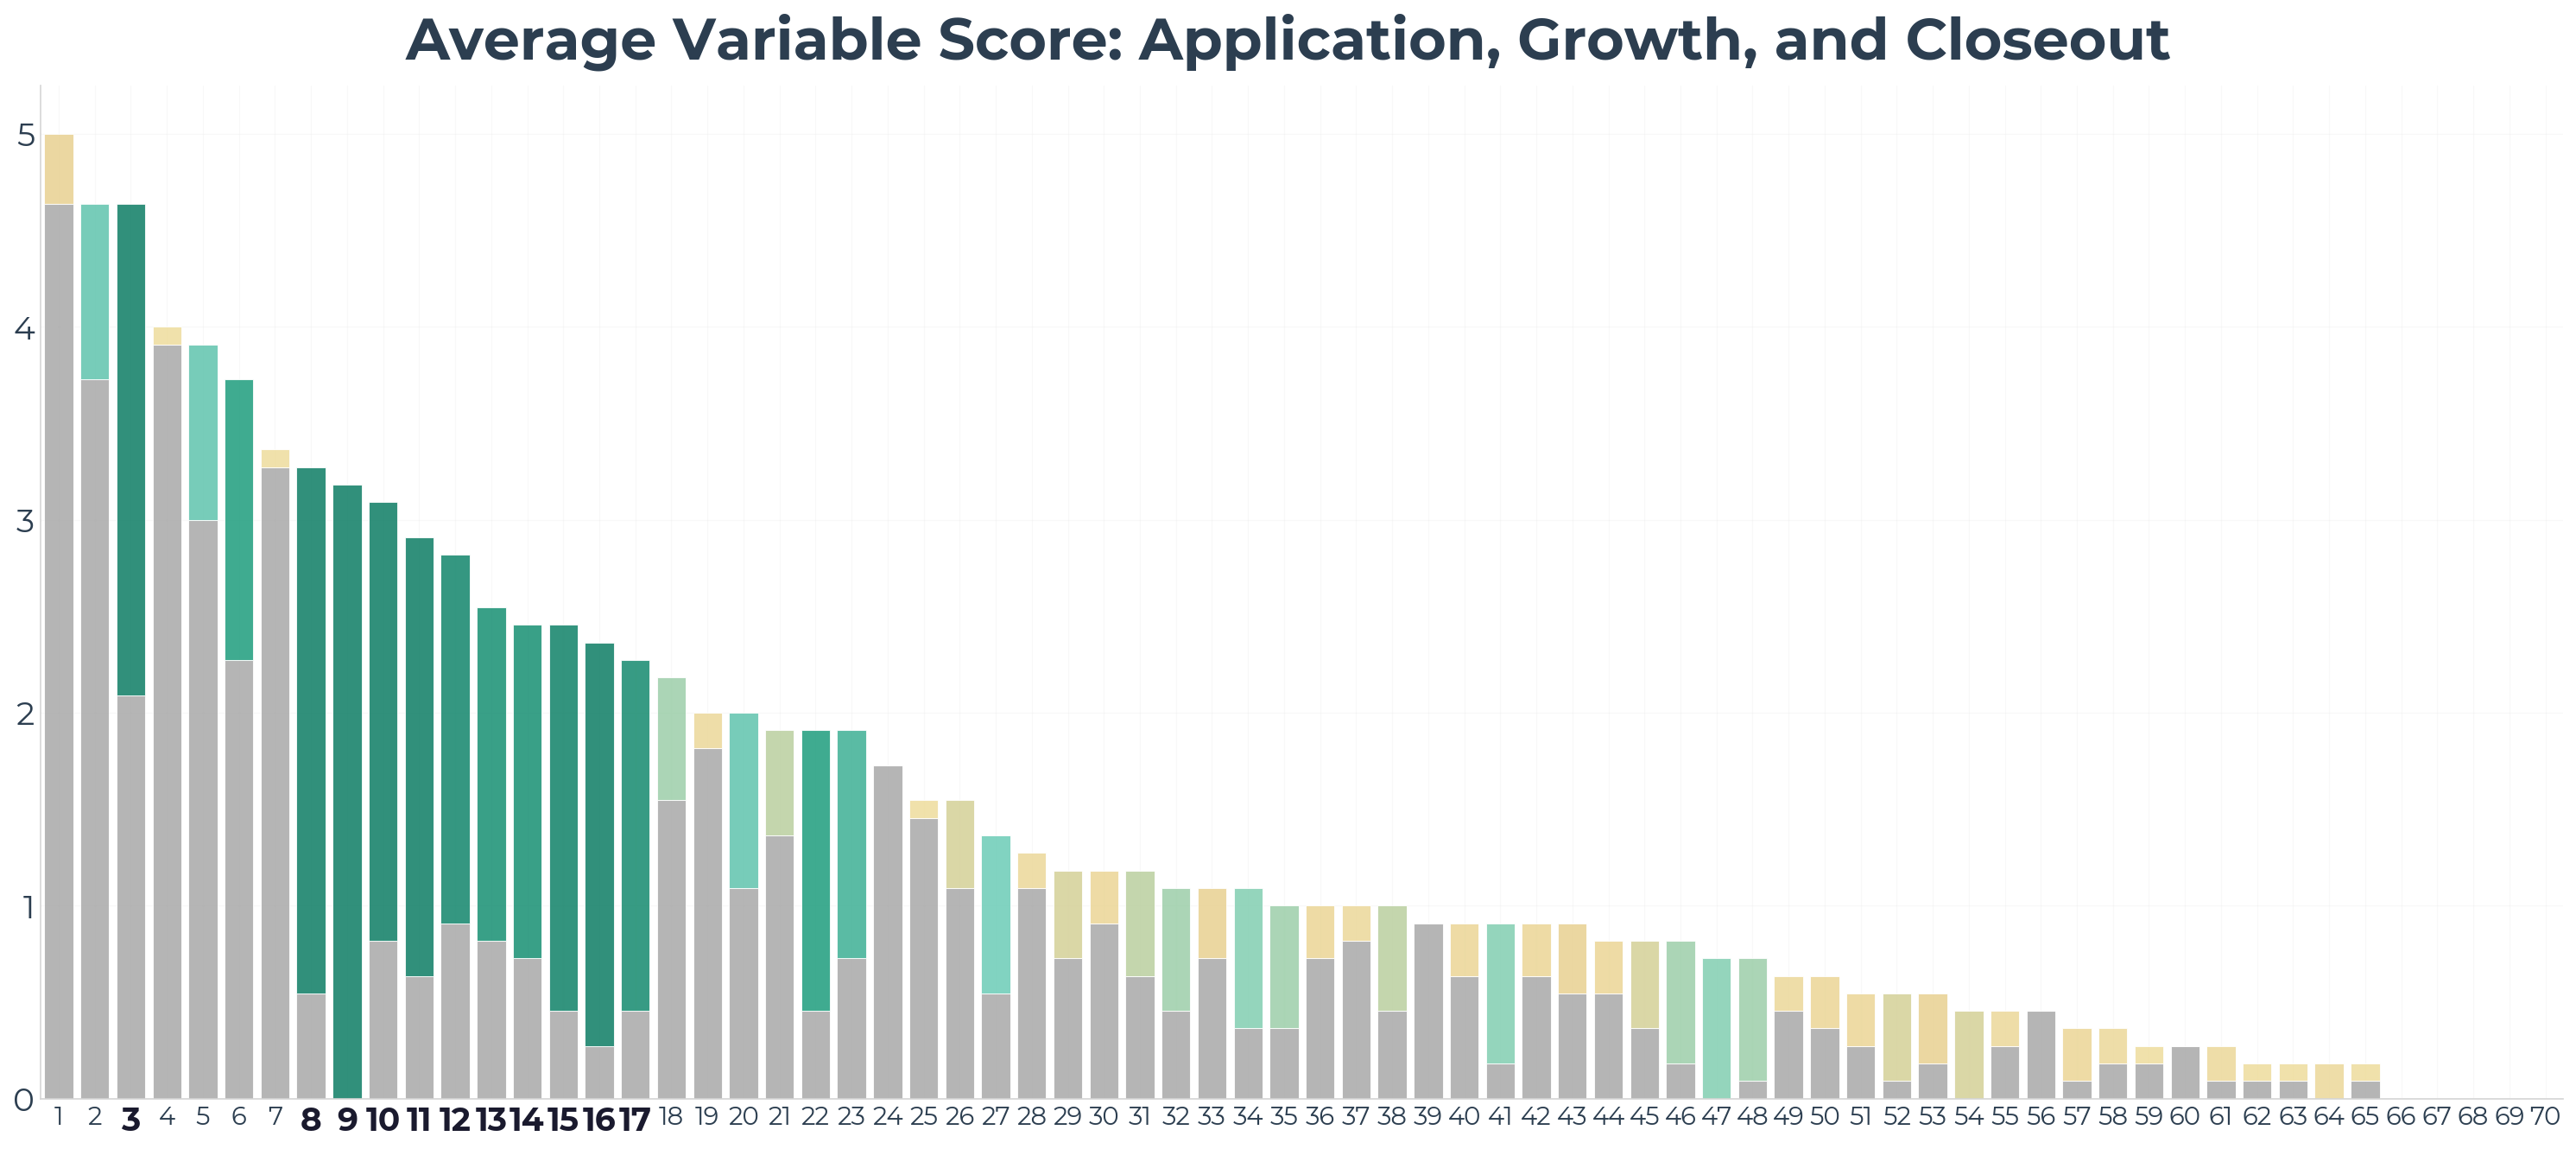
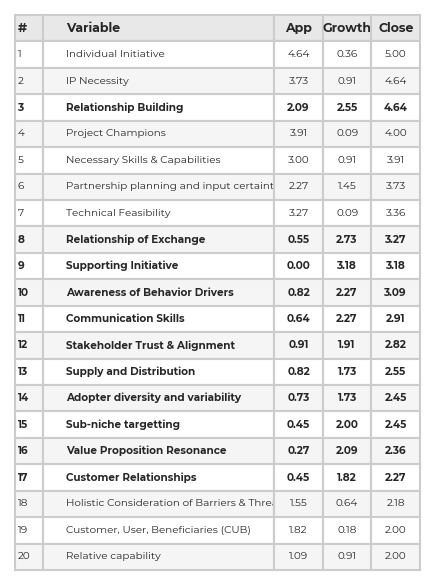
Chart 3b — Average Variable Score: Application, Growth, and Closeout
Variable Index
Page 13
4
Target Variables and Recommendations
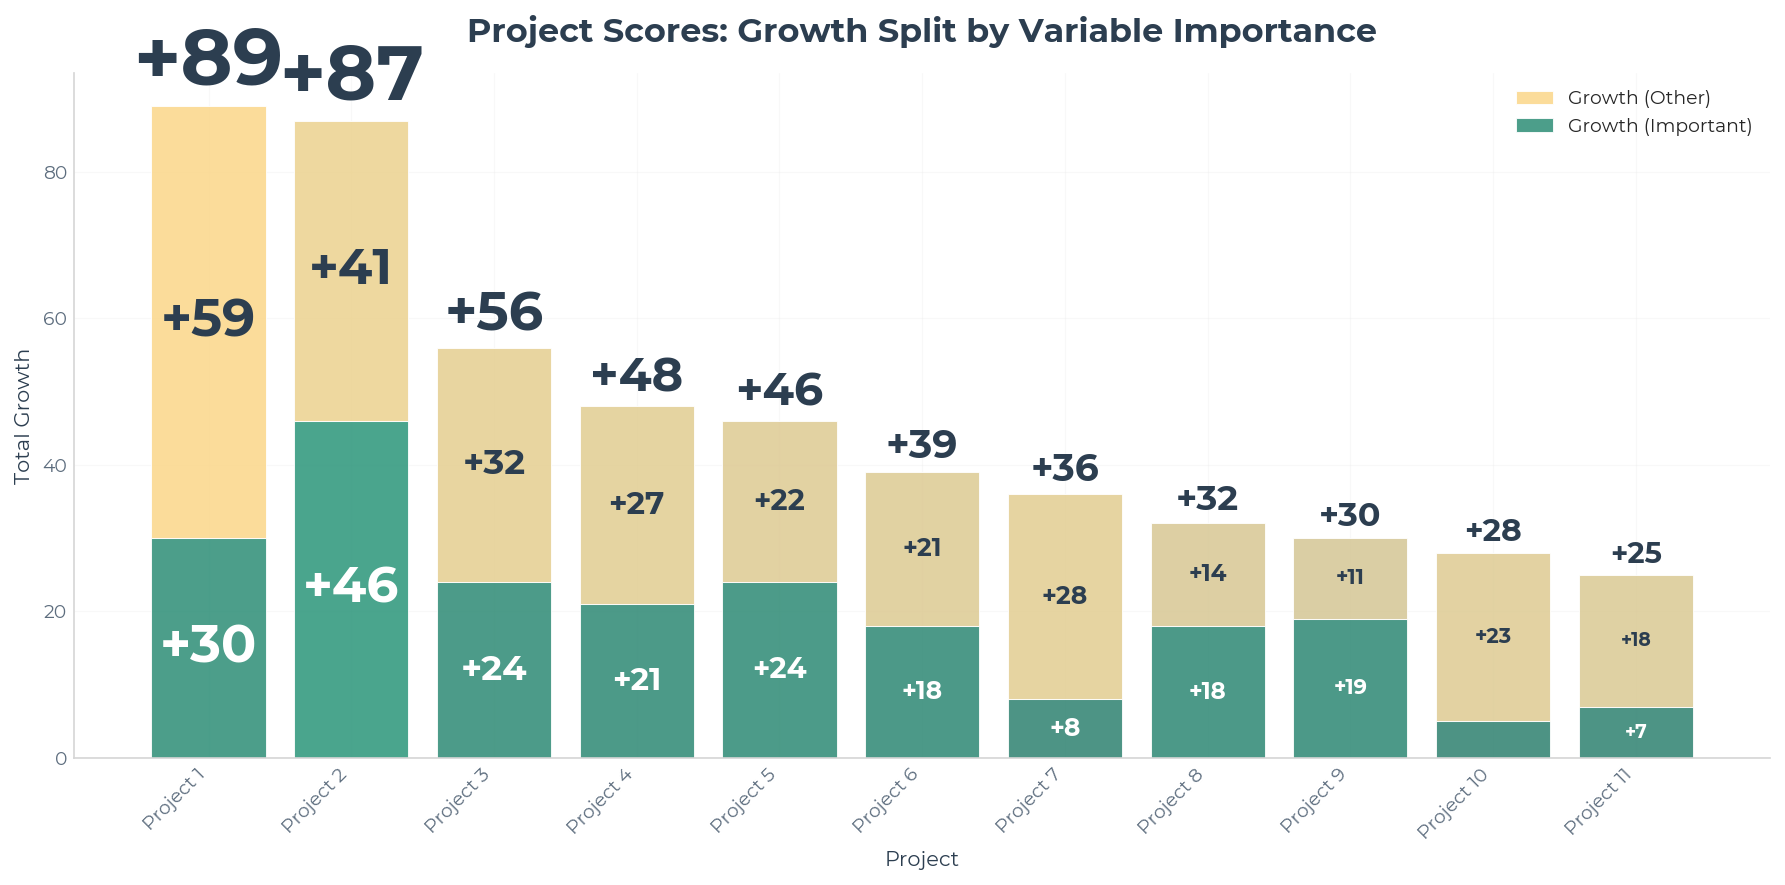
Chart 4a — Growth Split by Variable Importance
While data shows many targeted variables progressed substantially, some target variables did not
see a measurable improvement. More focus will be given to these select variables for cohort 2:
(1) Assumption awareness and elimination
(2) First hand experience with context of use and Context of use validation
(3) Clear roles and responsibilities
(4) Technical and Scientific dependencies
Page 14
5
Conclusions
A high average level of evidence is predictive of success. Conversely, failure to consider,
address, or mitigate certain variables has been established as a predictor of failure. For example,
a project that loses its champion is very likely to fail. Additionally, we hypothesize that a large
growth in a project's average evidence level is a positive indicator of success.
The analysis of project close-out reports clearly demonstrates the discussion of new and diverse
accomplishments. Participants of the program simultaneously deepened pre-existing strengths and
broadened their scope of consideration.
The average level of evidence demonstrated by participants substantially increased for a subset
of variables. Projects also tended to significantly diversify the number of variables considered.
Roughly 75% of variables improved were newly addressed variables, establishing that the program
has both increased awareness of causal variables of success and failure as well as quantifiably
improved the probability that participants will achieve adoption outcomes (and thus become a
viable business).
These projects have done well, but there's still a long way to go.
The end-goal is to achieve an average of 4.5 for all targeted variables
and an overall average of 3.75.
and an overall average of 3.75.